> ## Documentation Index
> Fetch the complete documentation index at: https://langchain-5e9cc07a-preview-toolre-1772123259-dfebfdb.mintlify.site/llms.txt
> Use this file to discover all available pages before exploring further.
# View server logs for a trace
When viewing a trace that was generated by a run in LangSmith, you can access the associated server logs directly from the trace view.
Viewing server logs for a trace only works with the [Cloud SaaS](https://langchain-ai.github.io/langgra/langsmith/observability-concepts/deployment_options/#cloud-saas) and [fully self-hosted](https://langchain-ai.github.io/langgra/langsmith/observability-concepts/deployment_options/#self-hosted-control-plane) deployment options.
## Access server logs from trace view
In the trace view, use the **See Logs** button in the top right corner, next to the **Run in Studio** button.
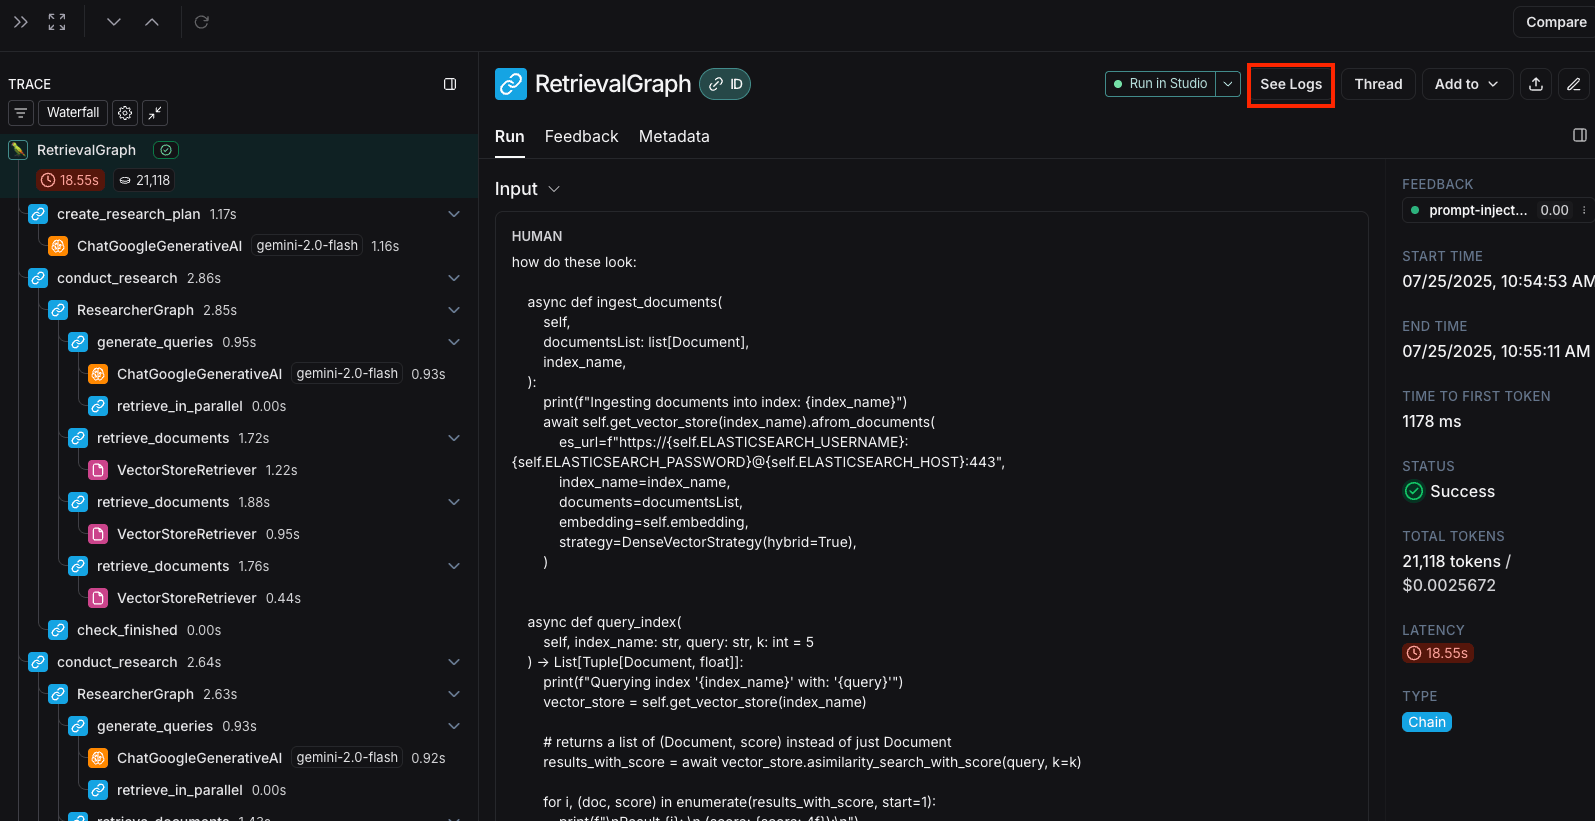 Clicking this button will take you to the server logs view for the associated deployment in LangSmith.
## Server logs view
The server logs view displays logs from both:
* **Agent Server's own operational logs** - Internal server operations, API calls, and system events
* **User application logs** - Logs written in your graph with:
* Python: Use the `logging` or `structlog` libraries
* JavaScript: Use the re-exported Winston logger from `@langchain/langgraph-sdk/logging`:
```javascript theme={null}
import { getLogger } from "@langchain/langgraph-sdk/logging";
const logger = getLogger();
logger.info("Your log message");
```
## Filtering logs by trace ID
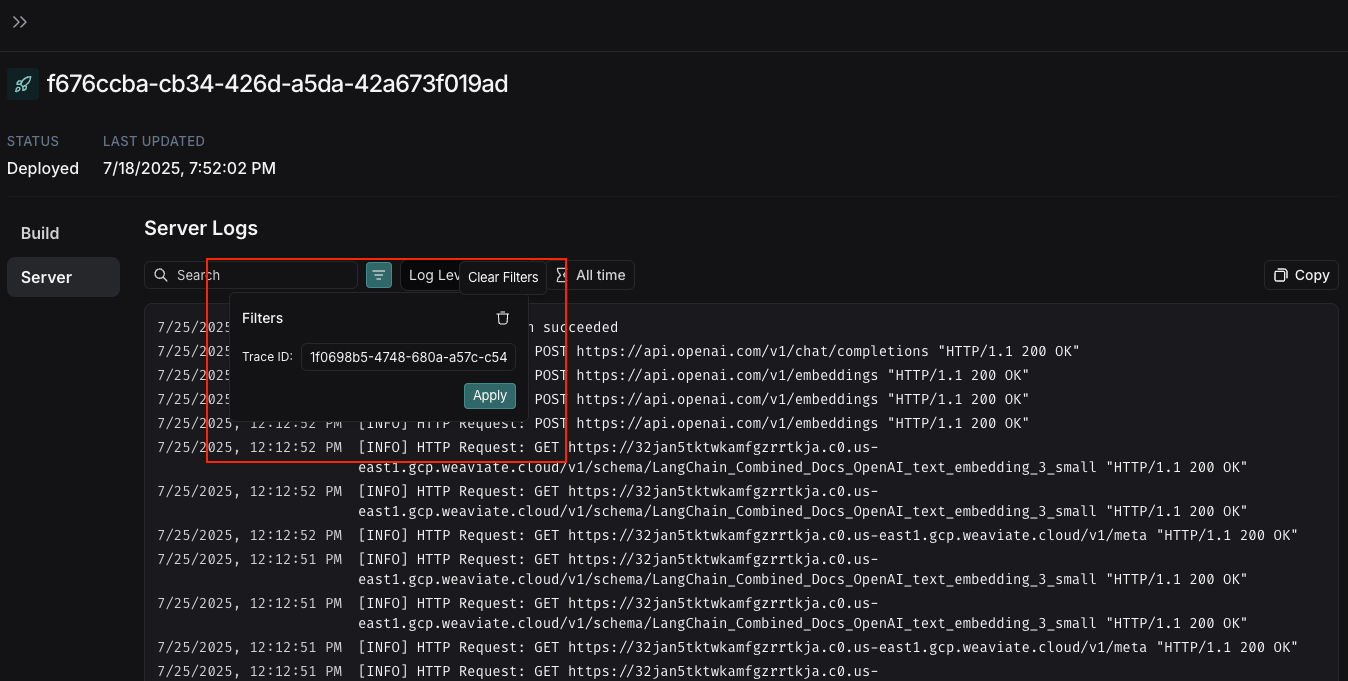
When you navigate from the trace view, the **Filters** box will automatically pre-fill with the Trace ID from the trace you just viewed.
This allows you to quickly filter the logs to see only those related to your specific trace execution.
Clicking this button will take you to the server logs view for the associated deployment in LangSmith.
## Server logs view
The server logs view displays logs from both:
* **Agent Server's own operational logs** - Internal server operations, API calls, and system events
* **User application logs** - Logs written in your graph with:
* Python: Use the `logging` or `structlog` libraries
* JavaScript: Use the re-exported Winston logger from `@langchain/langgraph-sdk/logging`:
```javascript theme={null}
import { getLogger } from "@langchain/langgraph-sdk/logging";
const logger = getLogger();
logger.info("Your log message");
```
## Filtering logs by trace ID
When you navigate from the trace view, the **Filters** box will automatically pre-fill with the Trace ID from the trace you just viewed.
This allows you to quickly filter the logs to see only those related to your specific trace execution.
 ***
[Edit this page on GitHub](https://github.com/langchain-ai/docs/edit/main/src/langsmith/platform-logs.mdx) or [file an issue](https://github.com/langchain-ai/docs/issues/new/choose).
[Connect these docs](/use-these-docs) to Claude, VSCode, and more via MCP for real-time answers.
***
[Edit this page on GitHub](https://github.com/langchain-ai/docs/edit/main/src/langsmith/platform-logs.mdx) or [file an issue](https://github.com/langchain-ai/docs/issues/new/choose).
[Connect these docs](/use-these-docs) to Claude, VSCode, and more via MCP for real-time answers.